Planning Pod is fully customizable to fit any of your event management and business needs, regardless of what business you are in. Let us create the right solution for you from our 40+ time-tested tools.
Learn about Planning Pod and why 70,000+ event and hospitality professionals have chosen our platform and company to help them manage their events and businesses.
Access expert guidance and insights via our blog, webinars and white papers. Learn about using our platform via our Help Center. Or contact us with questions.
12 Event Industry Statistics That Will Make You Think Twice [Infographic]
By
Jeff Kear
February 7, 2017
You hear a lot of predictions and anecdotal evidence about the events industry, but we here at Planning Pod also like data ... and lots of it. We were recently poking around the Web (our favorite timesink) and came across quite a few event industry statistics that didn't square with articles and social media posts we have been reading online. (Because everyone knows if it's on the Interwebs it must be true.) So, like the visual junkies we are, we decided to share it with you in the infographic below. Yes, we know, there are lies, damn lies, and statistics, but we feel these particular event-related statistics merit some attention.
12 Shocking Event Industry Statistics That Will Make You Think Twice
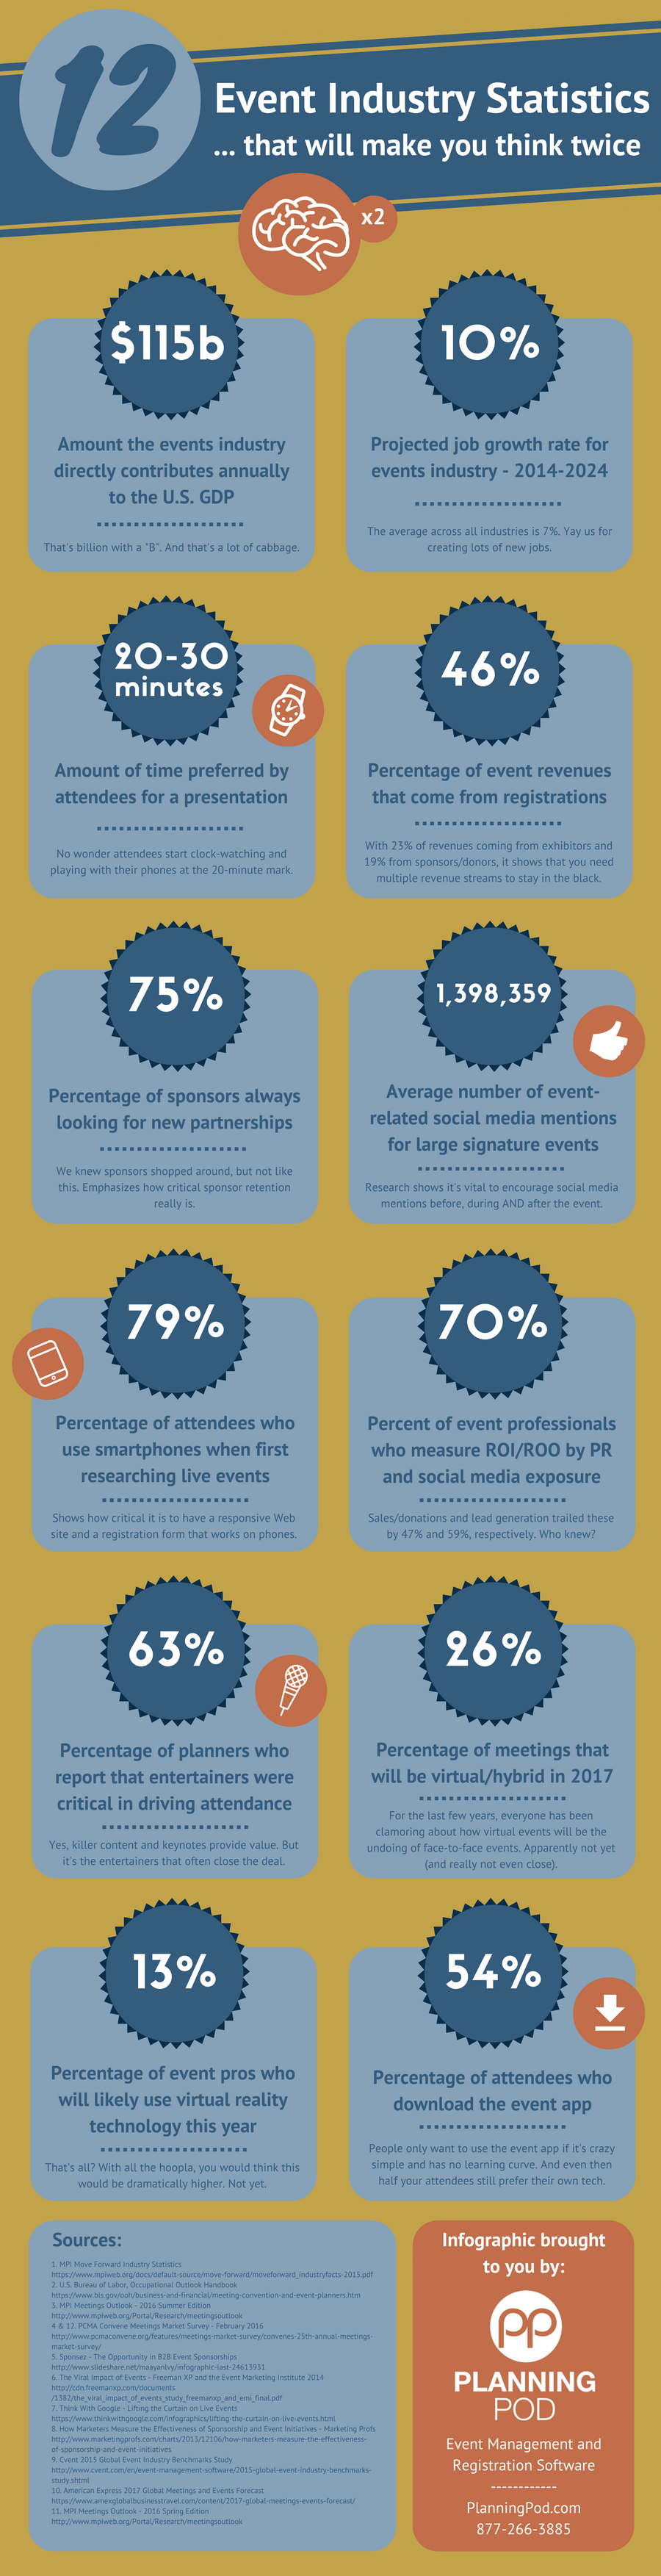
#1 - $115 billion
Amount the events industry directly contributes annually to the U.S. GDP
That's simply a lot of cabbage. And because there are few 800-lb gorilla companies in our industry, that revenue is spread across thousands of small businesses.
#2 - 10%
Projected job growth rate for events industry from 2014-2024
The average across all industries is 7%. Yay us for creating lots of new jobs.
#3 - 20-30 minutes
Amount of time preferred by attendees for a presentation (single-speaker event)
So much for the 45-60 minute speech. No wonder attendees start playing with their phones at the 20-minute mark.
#4 - 46%
Percentage of total event revenues that come from registration/ticket sales (on average)
With 23% of revenues coming from exhibitors and 19% from sponsors/donors, it shows that you need multiple revenue streams to stay in the black.
#5 - 75%
Percentage of sponsors who are constantly looking for new partnerships
We knew sponsors shopped around, just not this much. Emphasizes how critical sponsor retention really is.
#6 - 1,398,359
Average number of event-related social media mentions for large signature events
This includes mentions before, during and after the event, all of which are vital in generating and maintaining awareness.
#7 - 79%
Percentage of attendees who use smartphones when first researching live events
Shows how critical it is to have a responsive Web site that is easy to navigate. When you also consider that 80% of consumers eventually purchase a ticket after conducting an online search, it tells you your registration form should also be responsive.
#8 - 70%
Percent of event professionals who measure ROI/ROO by PR and social media exposure
These were the top two methods of measurement, with sales/donations dragging behind at 47% and lead gen at 59%.
#9 - 63%
Percentage of event professionals report that scheduling entertainers helped drive attendance
Yes, killer content and keynotes provide value. But it's the entertainers that often close the deal.
#10 - 26%
Percentage of meetings that will be virtual/hybrid in 2017
For the last few years, everyone has been clamoring about how virtual events will be the undoing of face-to-face events. Apparently not yet (and really not even close).
#11 - 13%
Percentage of event pros who will likely use virtual reality technology this year
With all the hoopla, you would think this would be dramatically higher. Think again.
#12 - 54%
Percentage of attendees who download the event app
Event Statistics, Event Stats, Business, Online Resources, Industry Intelligence and Research, Event Industry News, Event Industry, Infographic, Infographics, Event Management, Event Industry Research, Event Data


 Industries